Timeline diagrams let you visualize event chronology: project history, release roadmaps, and quarterly plans. They are a more visual alternative to text-based lists of dates and events.
Basic Syntax
timeline
    title FlowEra History
    2022 : Project idea
         : MVP prototype
    2023 : Closed beta
         : First users
         : Series A
    2024 : Open beta
         : v2.0 — Knowledge Base
         : v2.5 — Video calls
    2025 : Public launch
         : Enterprise edition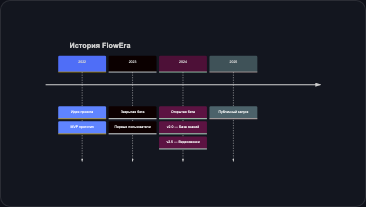
Sections
Use section to group periods:
timeline
    title Product Evolution

    section Early Stage
        2022 : Prototype
             : Team of 2
        2023 : MVP
             : Product-market fit

    section Growth
        2024 : Open beta
             : 1000+ users
             : Team expansion

    section Scale
        2025 : Enterprise
             : API integrations
             : Mobile apps
Example: Release History
timeline
    title FlowEra Release History

    section v1.x
        v1.0 : Basic kanban
              : Simple tasks
        v1.1 : Custom fields
              : Filters
        v1.2 : Iterations
              : Burndown charts

    section v2.x
        v2.0 : Knowledge base
              : Mermaid blocks
              : Dark theme
        v2.1 : Gantt charts
              : Portfolio view
        v2.2 : Video calls
              : Chat
              : Offline mode

    section v3.x (planned)
        v3.0 : AI assistant
              : Smart analytics
        v3.1 : Mobile apps
              : Public API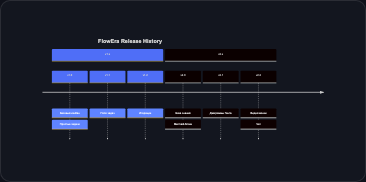
Tips
- Time points can be any strings: dates, quarters, versions, months
- Keep events brief — up to 4-5 words per event, otherwise the diagram gets cluttered
- Sections help group periods by theme (phases, versions, quarters)
- Alternative — for detailed planning with dependencies, use Gantt charts