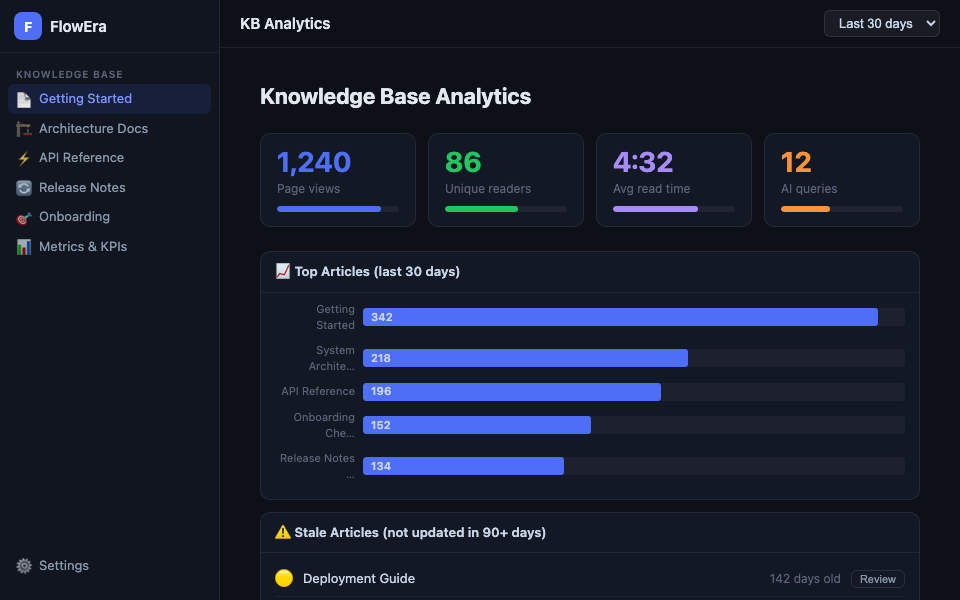
KB Analytics shows how your team uses the documentation: which articles are read most, how long readers spend on pages, and which content is stale.
Opening Analytics
KB Settings → Analytics or the 📊 button in the KB toolbar.
Metrics
| Metric | Description |
|---|---|
| Page views | Number of views for the period |
| Unique readers | Unique members who opened KB |
| Avg read time | Average time spent on a page |
| AI queries | Number of questions to the AI assistant |
Report period: last 7 days, 30 days, 90 days, or custom range.
Top Articles
List of the most-read pages with view counts and trends (growth/decline vs. previous period). Use to:
- Prioritize content updates
- Identify popular sections that need more detailed documentation
Per-Article Analytics
Open any article → ⋯ → Analytics for its stats:
- Daily view chart
- Unique readers
- Average time on page
- Read completion percentage (how far readers scroll)
- Traffic sources (from search, via link, navigation)
Stale Content
The Stale content tab lists articles not updated in 90+ days:
| Color | Age |
|---|---|
| 🟡 Yellow | 90–180 days |
| 🔴 Red | 180+ days |
Click Review next to an article to open and assess it. After checking, click Mark as reviewed — the article is removed from the list for 90 days.
Broken Links
The Broken links tab shows internal links pointing to deleted or moved pages. Click Fix to choose a new target URL.
Team Report
Admins can download a CSV report with all analytics for the period: KB Settings → Analytics → Export CSV.