Pie charts are the simplest diagram type in Mermaid. They are perfect for visualizing proportions and distributions: task statuses, error types, team workload breakdown.
Basic Syntax
pie
    title Task Distribution by Status
    "Backlog" : 42
    "In Progress" : 23
    "Review" : 12
    "Done" : 78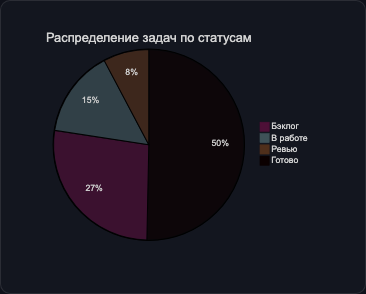
Showing Data Values
The showData keyword adds numeric values to the legend:
pie showData
    title Task Types in Sprint 23
    "Feature" : 15
    "Bug" : 8
    "Tech Debt" : 5
    "Docs" : 3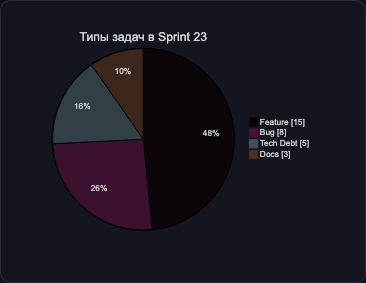
Examples
Time distribution by category
pie
    title Where the team's time goes
    "Development" : 45
    "Code Review" : 15
    "Meetings" : 20
    "Support" : 10
    "Documentation" : 10
Bug types in production
pie showData
    title Production Bugs (Q1 2024)
    "UI/UX" : 12
    "API" : 8
    "Performance" : 5
    "Security" : 2
    "Data" : 6
Test coverage
pie
    title Test Coverage
    "Covered" : 74
    "Not Covered" : 26